


K.P.I a fundamental tool for business management
If you have heard of KPIs before, chances are you have also encountered the term OKR. These two acronyms are widespread in the corporate world and are often used in complementary ways to monitor and improve an organization's performance. However, to fully understand their meaning and usefulness, it is important to explore in detail what they represent and how they differ.
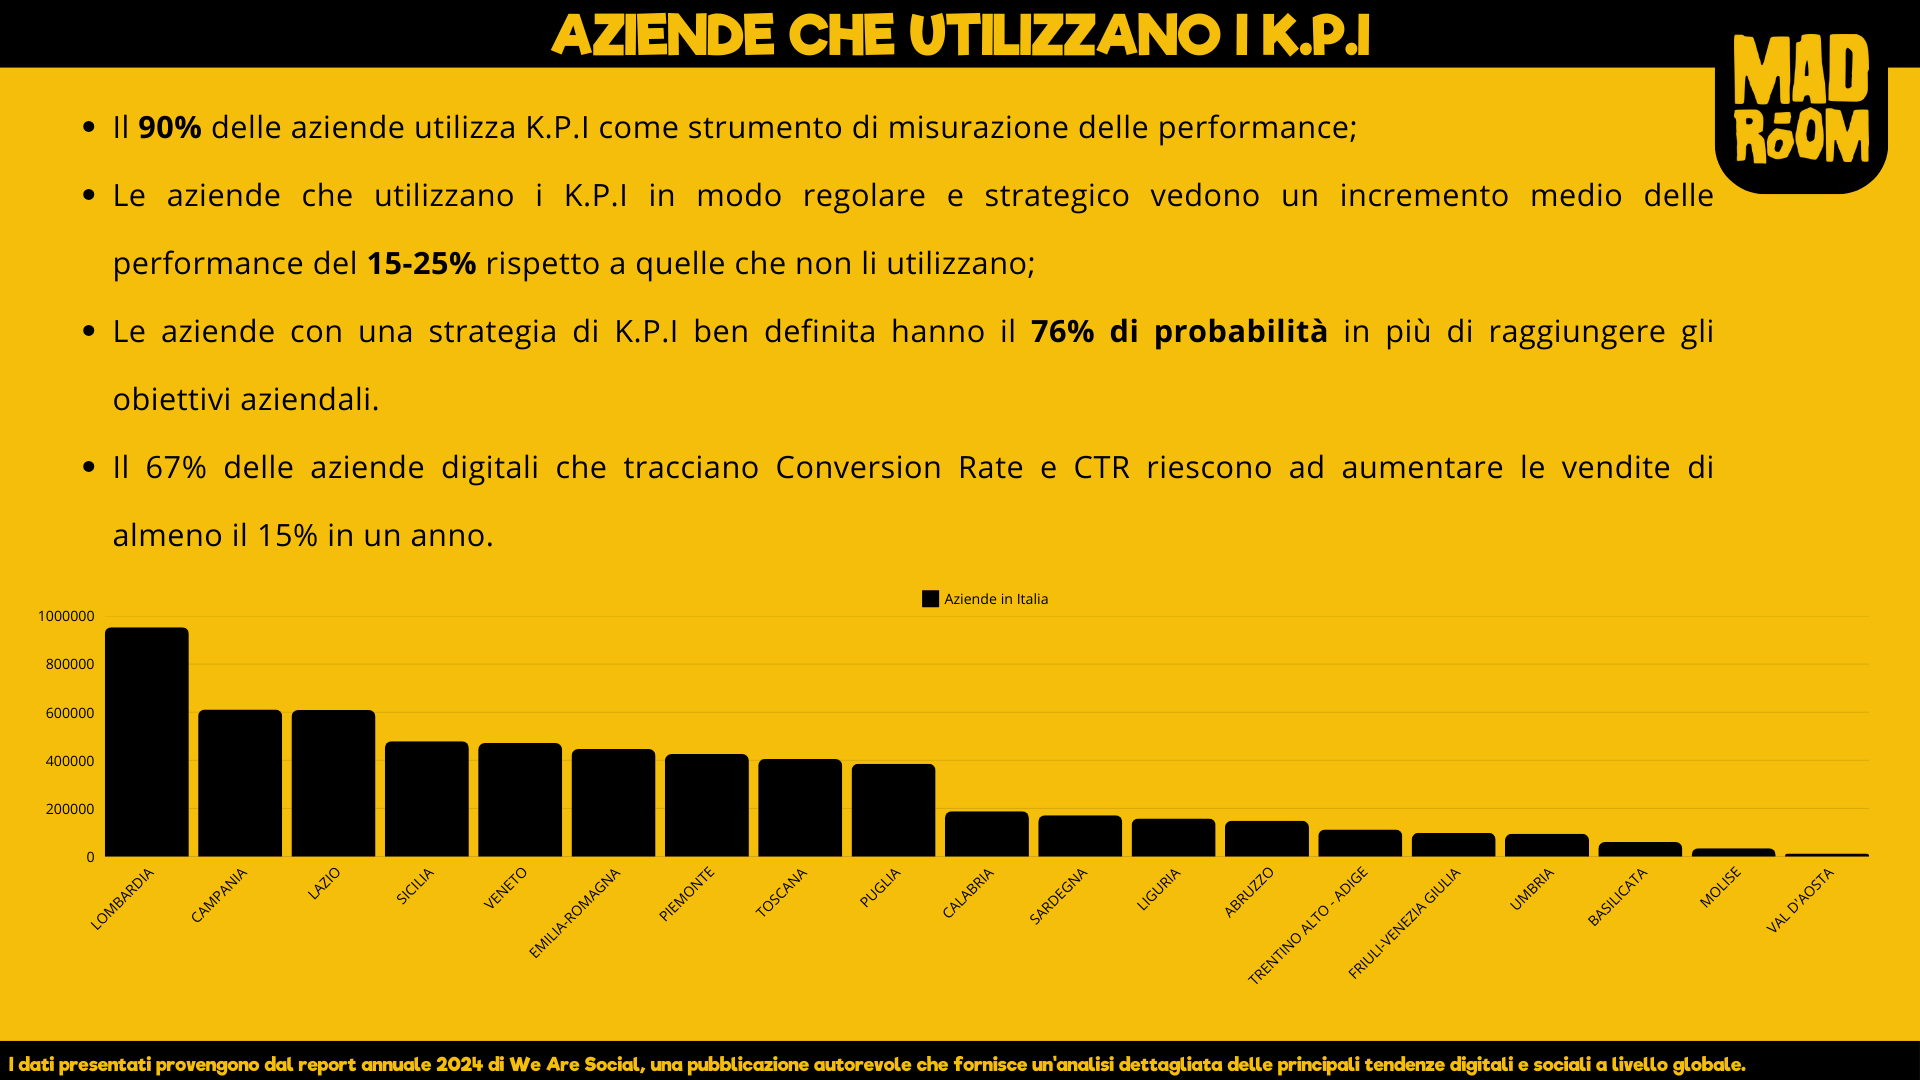
Key performance indicators (KPIs) are key tools for monitoring and measuring performance against set goals. Identifying the right kpi enables companies to make informed strategic and operational decisions.
What are the OKRs (Objectives and Key Results)?
OKRs, or Objectives and Key Results, provide a framework for setting and achieving strategic goals. Unlike KPIs, OKRs combine a comprehensive view of objectives with measurable outcomes that serve as metrics to monitor progress.
The structure of OKRs follows a simple but effective formula:
- Objective: What do I want to achieve?
- Key findings: How will I measure success in achieving this goal?
The goal, in this case, is a clear idea that defines what is intended to be achieved. Key outcomes, on the other hand, are specific metrics that quantify progress toward the goal. For example, if the goal is "improve customer experience," key outcomes might include a reduction in the churn rate to less than 2% per month or an increase in Net Promoter Score (NPS) by 2 points over a year.
How do KPIs and OKRs differ?
Although KPIs and OKRs have similar purposes, namely to guide and measure success, their applications are different.
- I KPI are specific metrics that reflect performance on a particular aspect and serve as indicators of business health. They are mainly focused on monitoring and optimizing an existing business.
- The OKR, on the other hand, have a more strategic function. They focus on what an organization wants to achieve and include key outcomes that clearly indicate whether progress is being made toward the set goal.
In other words, KPIs can be considered "monitoring tools," while OKRs are a combination of strategic vision and measurement. Moreover, the key outcomes of OKRs can include both quantitative and qualitative measures, while KPIs must always be quantifiable.
If you run an e-commerce business, it is critical to monitor specific KPIs to assess the effectiveness of your operations and strategies. These metrics will help you better understand the performance of your business and make informed decisions to improve your profitability.
Sales KPIs
These KPIs measure performance related to sales activities, providing data on team effectiveness and revenue generation.
Sales Volume
Sales volume represents the total amount of products or services sold in a given period. This KPI is critical in evaluating a company's performance and can be measured in units sold or in monetary value.
It measures the total amount of products sold. For example, if e-commerce sells 500 units of the new line in one month, this is a key indicator of success
Total Revenues
Total revenue is the total amount of sales generated by a business in a given period. They are calculated by adding up the value of all sales made, without considering any returns or discounts.
Conversion Rate
Conversion rate measures the percentage of visitors to a website who take a desired action, such as making a purchase or filling out a form.
It is calculated as:
A high conversion rate indicates that the site is effective in persuading visitors to take the desired action.
Measures the percentage of visitors who make a purchase. If the site receives 10,000 visitors and 500 of those visitors purchase, the conversion rate is 5%.
Average Order Value (AOV).
AOV represents the average value of each order placed by customers. It is calculated by dividing total revenue by the total number of orders:
If the total revenue is 20,000 euros and there are 500 orders, the AOV is 40 euros. A higher AOV may indicate effective cross-selling.
Sales Closing Time
Sales closing time measures the average time it takes to convert a lead into a paying customer. A shorter closing time is generally preferable, as it indicates a more efficient sales process.
If the average time to close a sale is 3 days, this KPI can be optimized to improve efficiency.
Market Share
Market share represents the percentage of a company's total sales to total sales in its target market. It is calculated as:
If the cosmetics market is worth 500,000 and the company generates 20,000 in sales, the market share is 4%.
A higher market share indicates a stronger competitive position within the industry.
Marketing KPIs
In the context of an e-commerce with active promotional activities, marketing KPIs assume a strategic role in assessing the effectiveness of campaigns and optimizing performance in real time. These key indicators make it possible to monitor the results of actions taken, identify opportunities for improvement and quickly adapt strategies to maximize return on advertising spend (ROAS).
Impression
Impressions are the total number of times a piece of content (such as an ad or social media post) is viewed. Even if a person sees the same content multiple times, each view counts as an impression.
Reach
Reach is the total number of unique users who viewed a piece of content. Unlike impressions, reach counts only unique users, so if a person views a piece of content multiple times, it is counted only once.
Social Media Engagement (Likes, Comments, Shares)
It measures the engagement generated by promotional campaigns on social media. This KPI indicates not only the effectiveness of promotional activities, but also the degree of emotional connection with the audience.
Conversion Rate (CR)
It measures the percentage of site visitors who complete a desired action, such as purchasing a product. This KPI is essential for evaluating the effectiveness of landing pages, advertising campaigns, and the overall user experience.
CPM (Cost Per Thousand)
CPM is the cost per thousand impressions. It is a metric used to calculate the cost of online advertising, indicating how much an advertiser pays per thousand views of his or her ad.
If the company spends 500 euros per 100,000 impressions, the CPM is 5 euros.
CTR (Click-Through Rate)
CTR is the click-through rate, which measures the percentage of people who click on a link relative to the total number of views (impressions).
It is calculated as follows:
Example: If your ad received 1,000 impressions and 50 clicks, the CTR is 5%.
CPC (Cost Per Click)
CPC is the cost per click. This metric indicates how much an advertiser pays for each click received on an ad. It is particularly relevant in pay-per-click advertising campaigns.
If the company spends 200 euros for 100 clicks, the CPC is 2 euros
Average Duration of Involvement
Average engagement duration measures the average time users spend interacting with a piece of content. It is useful for understanding how well a piece of content manages to keep users' attention.
Rebound Rate
The bounce rate measures the percentage of visitors who leave a website after viewing only one page, without interacting further.
It is calculated as follows:
A high bounce rate may indicate that the content is not relevant or interesting to users.
CPA (Cost Per Acquisition)
CPA is the cost per acquisition and measures how much a company spends to acquire a new customer. This metric can include various costs related to marketing and sales.
It is calculated as follows:
Example: If you spend 500 euros on advertising and acquire 25 new customers, the CPA is 20 euros. A low CPA indicates an effective campaign in converting users into customers.
ROAS (Return on Advertising Spend)
ROAS is the return on advertising expenditure and measures the effectiveness of an advertising campaign. It indicates how much revenue each unit of currency spent on advertising generates.
It is calculated as:
Example: If you spend €200 on an advertising campaign and generate €800 in sales, your ROAS is 4.0, indicating that for every €4 spent, you generate €4.
Email open rate
Email open rate measures the percentage of recipients who open an email relative to the total number of emails sent. It is an important metric for evaluating the effectiveness of email campaigns.
It is calculated as follows:
If 2,000 emails are opened out of 10,000 sent, the open rate is 20%, which is useful for measuring the effectiveness of email campaigns.
Abandoned trolley rate
Calculate the percentage of customers who add products to the cart but do not complete the purchase. A high abandonment rate may require interventions such as targeted offers, recovery emails, or improvements in the checkout process.
Traffic Source
Analyzing the source of traffic (organic, paid, email marketing, social media, etc.) helps to understand which channels are contributing most to the success of promotional activities.
By monitoring these KPIs, an e-commerce business can accurately measure the impact of its promotional activities and identify the most effective strategies for attracting and retaining customers. Analyzing this data on an ongoing basis allows one to not only optimize the performance of current campaigns, but also to refine future promotional initiatives to ensure even better results.
Customer KPIs
Customer KPIs are key metrics for measuring a company's success in meeting the needs of its customers and for optimizing strategies to improve interaction and value delivered. These indicators, often used in combination with other business metrics, allow monitoring critical aspects such as satisfaction, loyalty, purchasing behavior and value generated by customers over time.
Customer Satisfaction Score (CSAT)
The CSAT measures the level of customer satisfaction with a product or service. Generally, it is measured by surveys in which customers rate their satisfaction on a scale (e.g., 1 to 5). CSAT is calculated as:
Net Promoter Score (NPS)
The NPS measures the likelihood that customers will recommend a company or product to others. It is calculated by subtracting the percentage of detractors (those who score 0 to 6) from the percentage of promoters (those who score 9 to 10):
Retention Rate
The retention rate measures the percentage of customers who remain loyal to a company over a given period.
It is calculated as:
Customer Lifetime Value (CLV)
CLV represents the total value that a customer brings to the company during his or her entire relationship. It is calculated by considering the average order value, the frequency of purchases and the average duration of the relationship:
Abandonment Rate (Churn Rate)
The churn rate measures the percentage of customers who stop using a service in a given period.
It is calculated as:
Customer Service Response Time
Customer service response time measures the average time taken to respond to customer inquiries. It can be calculated as the average response time for all requests received in a given period:
Average Revenue Per User (ARPU)
Measures the average revenue generated by each customer over a specific period. It is useful for assessing overall customer profitability and identifying opportunities for growth.
Customer Effort Score (CES)
Assess how easy it was for a customer to complete a specific action, such as making a purchase or solving a problem. A low level of effort is often correlated with higher satisfaction and loyalty.
Conclusions
I KPI and the OKR represent essential tools for business management, each with a distinct but complementary role. I KPI monitor operational performance, providing a detailed view of the effectiveness of existing activities, while the OKR guide organizations toward ambitious strategic goals by combining vision and measurement.
In the context of an e-commerce business, adopting specific KPIs for sales, marketing and customer management enables accurate assessment of the effectiveness of strategies and evidence-based decision making. Regularly monitoring metrics such as the conversion rate, the ROAS o the average value of the order is critical to optimizing performance and improving competitiveness.
Integrate KPI and OKR in a coordinated approach allows companies to balance the achievement of strategic goals with careful measurement of day-to-day operations, fostering sustainable growth and alignment between short- and long-term goals.